Qlik Meetup Astana
6 May 10 AM Central Time | 17:00 Berlin - Paris
Fixing a fundamental flaw in Qlik Sense
Work with the topology of Star data models
Star-topology limits for business intelligence tasks
Work with the topology of Star data models
Star-topology limits for business intelligence tasks


This event will be held virtually
FEATURED SPEAKERS
Co-founder of Datanomix.pro | Founder of Git and Qlik sense integration product - Gitoqlok
Creator of data modeling automation system | 7+ years of full-time Qlik Sense Development
Alexander Polorotov
Evgeny Stuchalkin
HOST
You will need to have access to a Laptop or suitable device to participate.
Log in details will be sent out to you via email once you have enrolled.
Business Intelligence Consultant with strong competence in the implementation of business intelligence competency centers and creating complex data models and data dashboarding with Qlik Sense. Creator of the product Gitogolok.
At current moment mostly focused on creation of automated instruments for Qlik developers. All projects in our team already produced with our automated data-modeling framework. We use this frame work as foundation for self-service implementation on client side.


ABOUT WEBINAR
Fixing a fundamental flaw in Qlik Sense, that costs your developers and analysts up to 50% of their time each month.
Let's admit it. With all the advantages of the Qlik platform, it has an extremely weak, but very important side - the construction of data models. We all have seen commercials where users, by dragging “circles” on top of each other, build an associative data model, and immediately start working with it.
At first glance, everything is cool - there are no primary/secondary keys, no relationship types, no relationship directions. But everyone who works seriously with Qlik knows that this scenario is only suitable for primitive models - with one fact table in the center, and bunch of dictionaries around it.
Do you want to analyze the data according to the plan-fact scenario, where the data is located in 2 tables? You already need to come up with a scheme with a composite key.
Do you want to analyze the data according to the plan-fact scenario, where the data is located in 2 tables? You already need to come up with a scheme with a composite key.
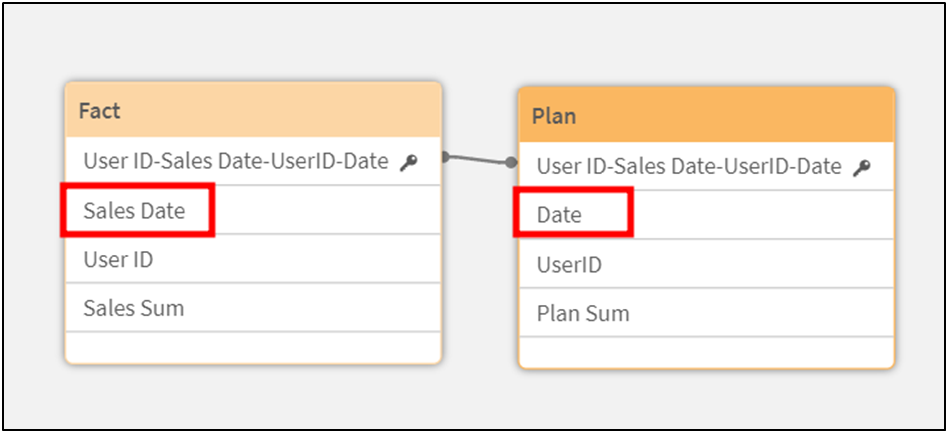
In fact, in this model, dates are represented by two different fields. Means, you can’t visualize it properly on one date axis.
What if one of the tables has not one field with a date, but two? We need to create a canonical date field, and this:
1) Can be considered impossible to do in a “bubble builder”
2) A concept that needs to be understood and cannot be done by a simple business user.
Actually, this is just the top of the iceberg. The fact is that due to the peculiarities of the associative engine, a situation may arise when you physically cannot assemble a data model, where tables are connected directly to each other.
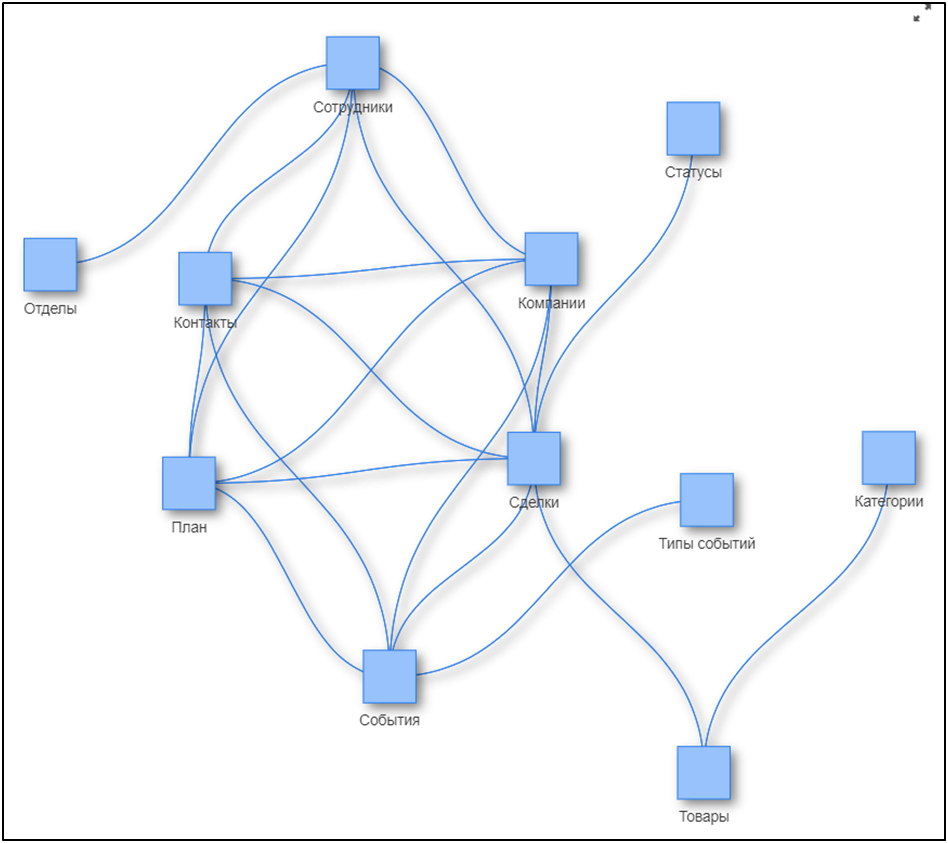
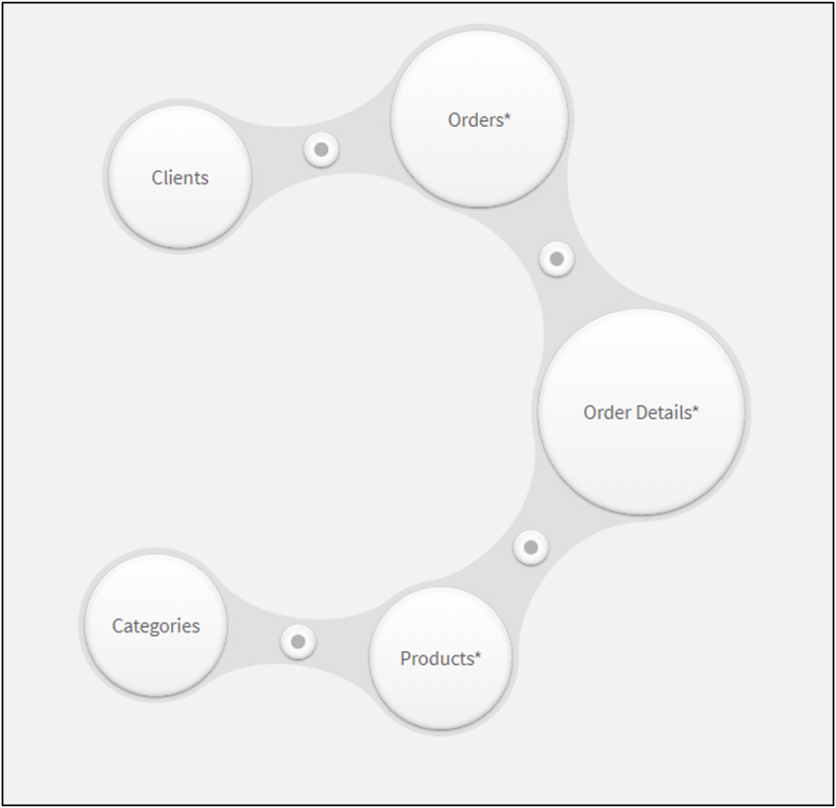
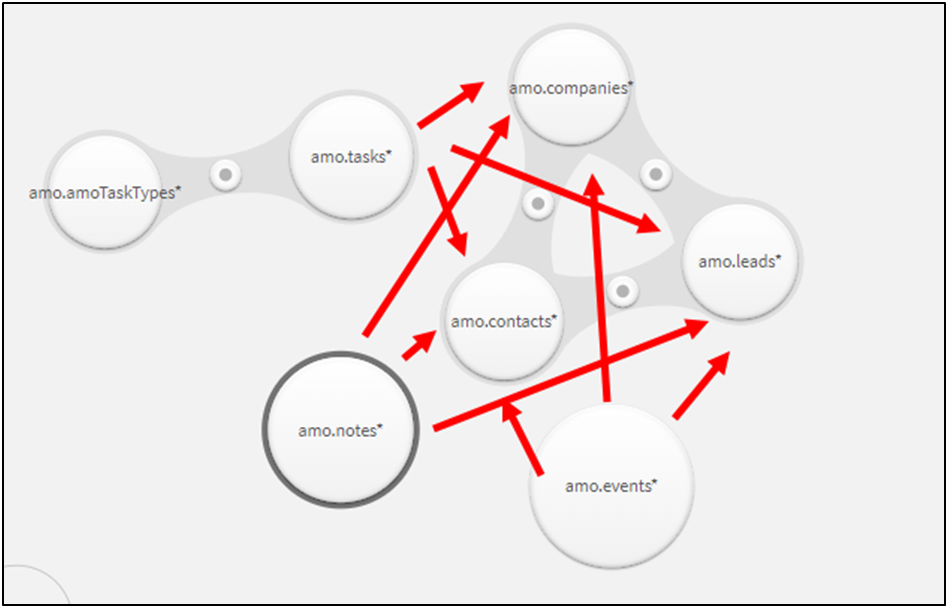
Tasks, notes, and events can be linked to contacts, deals, and companies. Good luck collecting this in the data manager). By the way, behind the scenes there was a Users table that has a connection with each table of this model.
Anything can happen. From cyclic connections to the inability to get the desired logic of the model. And if you managed to assemble the model in such a way that it works now, then in the future, when adding new data, you can come to a dead end. Because your tasks have gone beyond the capabilities of the data manager.
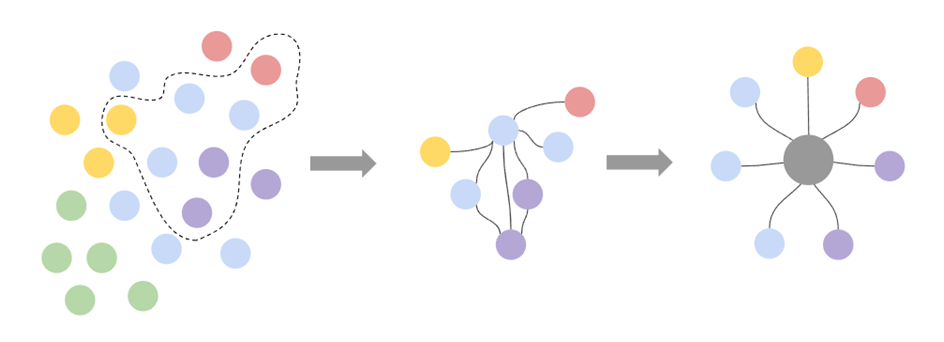
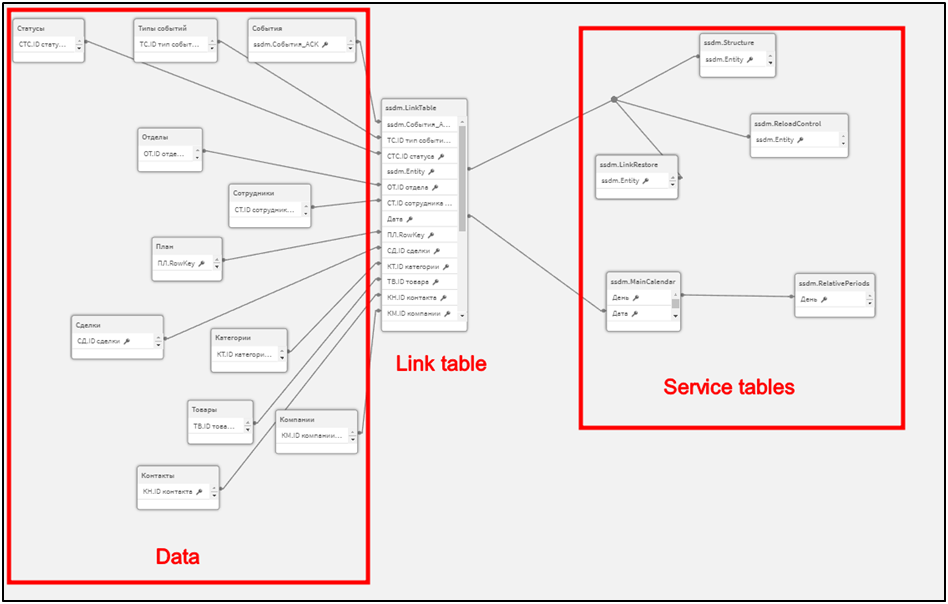
Therefore, in the end, data models in analytical applications begin to come down to the Star topology: tables are not connected to each other, but through a central bridge containing a set of links for each model table to all other tables. And here comes the part that costs you a lot of money and time.
The matter is that you must write a script for Qlik, for Link table generation. That in itself takes time. But the fact that scripts are written by programmers, i.e. people, leads to the fact that they create a difficult to maintain business application architecture. See for yourself.
Anything can happen. From cyclic connections to the inability to get the desired logic of the model. And if you managed to assemble the model in such a way that it works now, then in the future, when adding new data, you can come to a dead end. Because your tasks have gone beyond the capabilities of the data manager.
Therefore, in the end, data models in analytical applications begin to come down to the Star topology: tables are not connected to each other, but through a central bridge containing a set of links for each model table to all other tables. And here comes the part that costs you a lot of money and time.
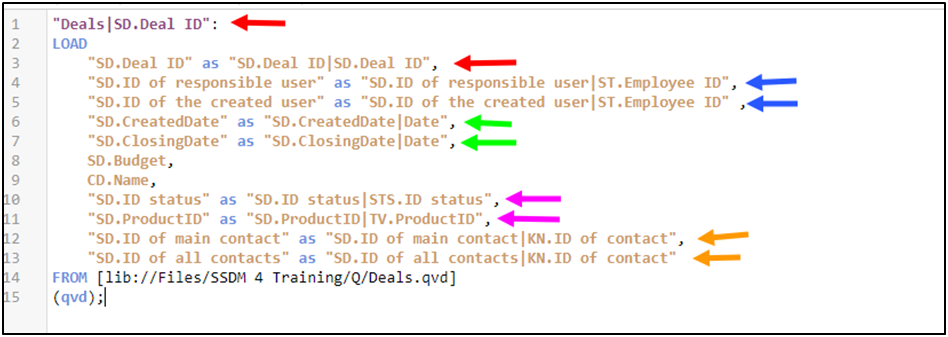
The matter is that you must write a script for Qlik, for Link table generation. That in itself takes time. But the fact that scripts are written by programmers, i.e. people, leads to the fact that they create a difficult to maintain business application architecture. See for yourself.
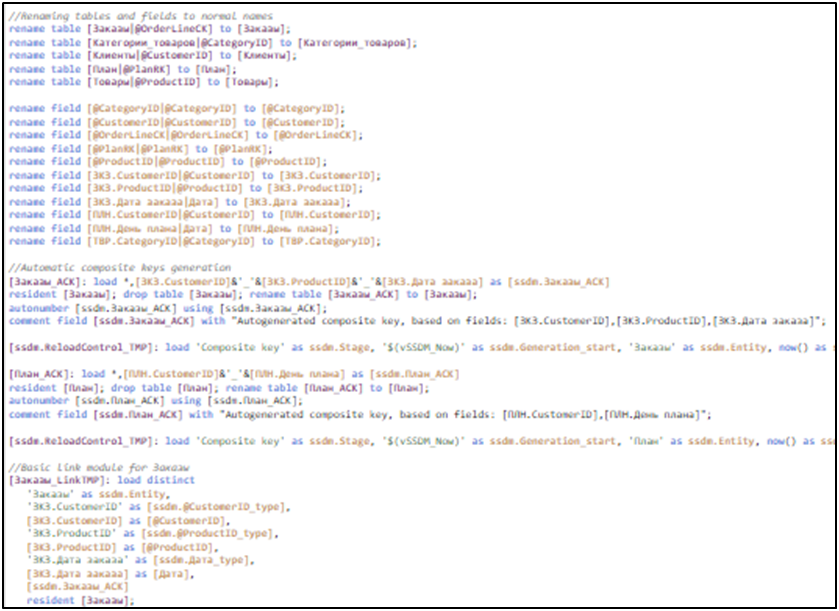
Fragment of the script for creating a data model
We have a number of analytical tables (Views), that are prepared by some tool. When creating an application in Qlik, we need to write a data model creation script. By creating several applications based on the same set of Views, we will get models that are incompatible with each other with a 99% probability. Why? Because of the human factor.
We have always hired highly qualified developers for our projects. They were great at writing complex data transformation scripts. Means they effectively solved distinctive, creative non-trivial tasks. But when it comes to models, uniformity, standardization, and pipelineability become important.
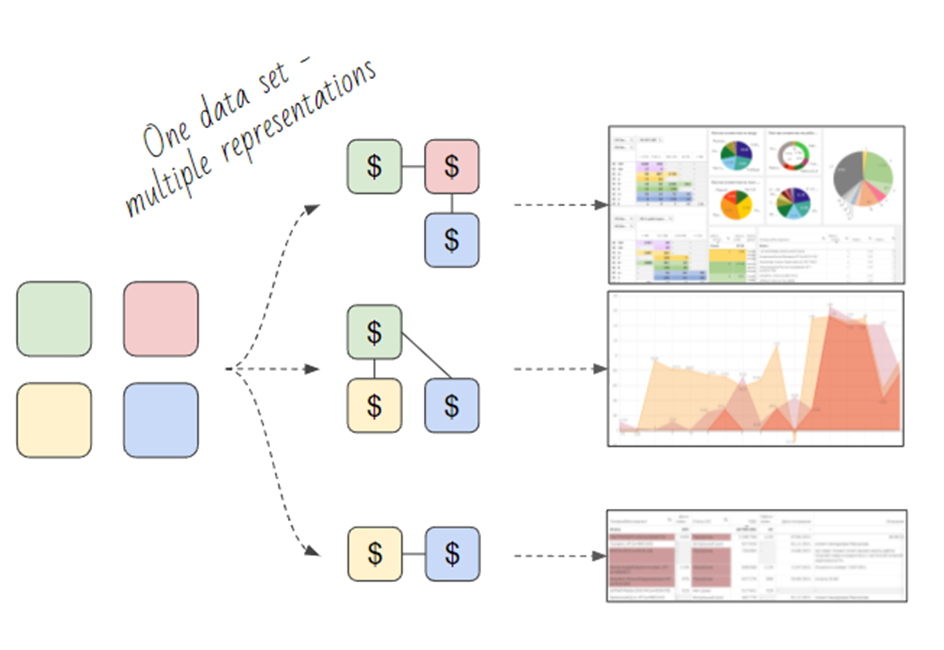
Look. You have created data models for different departments that solve the task, but each of them is written in its own way. Somewhere we joined dictionaries, somewhere not. Somewhere fields was renamed. Somewhere we made a link block that works specifically inside this model. And suddenly, we need to add an array of data from a new source to each of the models. We will have to do this 3 times, adjusting to the specifics of each application.
We have a number of analytical tables (Views), that are prepared by some tool. When creating an application in Qlik, we need to write a data model creation script. By creating several applications based on the same set of Views, we will get models that are incompatible with each other with a 99% probability. Why? Because of the human factor.
We have always hired highly qualified developers for our projects. They were great at writing complex data transformation scripts. Means they effectively solved distinctive, creative non-trivial tasks. But when it comes to models, uniformity, standardization, and pipelineability become important.
Look. You have created data models for different departments that solve the task, but each of them is written in its own way. Somewhere we joined dictionaries, somewhere not. Somewhere fields was renamed. Somewhere we made a link block that works specifically inside this model. And suddenly, we need to add an array of data from a new source to each of the models. We will have to do this 3 times, adjusting to the specifics of each application.
We not only spent time writing code. We spend 3 times more time on its support and improvements, scaling. And we are approaching the moment when we will have to refactor the entire solution in order to bring it to a single form. We depend on the people who wrote these models, because only they know exactly how everything works there. Or maybe they don’t know, because several months have passed, and they developed the solution as closing the problem in the moment, not thinking about further scaling.
It would seem that the standards should save the situation. but actually no. Because if a person writes the code, he will always do it a little differently. And you will have to spend resources on monitoring standards, and bringing decisions to this standard.
Faced with this situation 4 years ago, we decided that clear guidelines would help us develop applications easier and faster. After writing them, we realized that the actions that we expect from developers can be automated. Thus began the story of creating an automatic generator of data models for Qlik - Super Star Data Model. In the next article, we will share what results we got, how it works, and how you can apply our experience in your business.
2. How to work with the topology of Star data models, and not bury yourself.
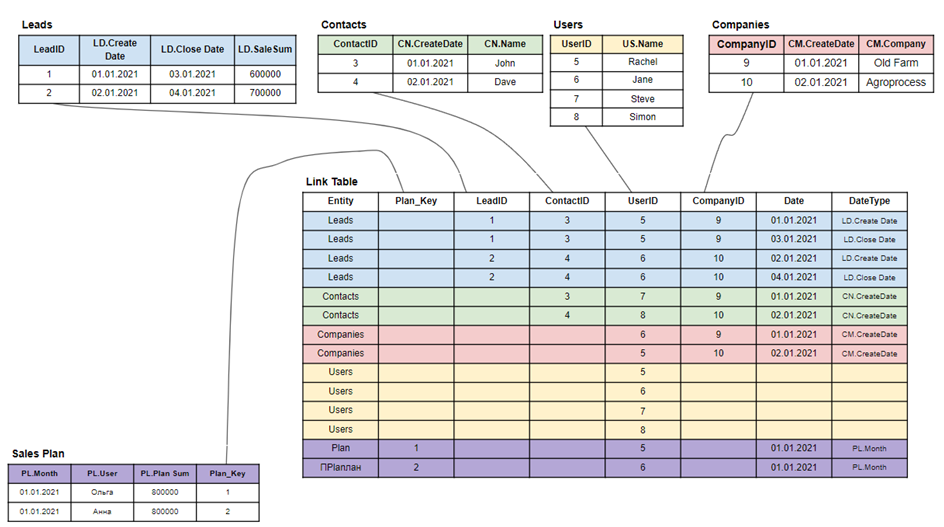
Due to the nature of Qlik's associative engine, the Star topology is the only way to implement complex data models. This approach is well described in the “Unified Star Schema” paradigm by Francesco Puppini and Bill Inmon. Unlike the relational model, in the Star topology, tables are not connected to each other, but through a central bridge (link table).
The star can be presented in 2 versions: the central table contains fields for calculating measures and general measurements. Dimension tables hang around the central table like the rays of a star. This option is used to optimize cross-tab calculations and may not works with complex models, especially with one-to-many links scenarios. Because of data duplication in central table.
Or, only common dimensions (key fields) are placed in the central table. As well as additional link options. This allows you to implement complex connection scenarios, because a relationship can be described not by one specific value, but by several. For example, to aggregate the amount of sales by employees by user role: by current responsible, or by those who created the deal.
The data tables are joined to the link table by the primary key.
It would seem that the standards should save the situation. but actually no. Because if a person writes the code, he will always do it a little differently. And you will have to spend resources on monitoring standards, and bringing decisions to this standard.
Faced with this situation 4 years ago, we decided that clear guidelines would help us develop applications easier and faster. After writing them, we realized that the actions that we expect from developers can be automated. Thus began the story of creating an automatic generator of data models for Qlik - Super Star Data Model. In the next article, we will share what results we got, how it works, and how you can apply our experience in your business.
2. How to work with the topology of Star data models, and not bury yourself.
Due to the nature of Qlik's associative engine, the Star topology is the only way to implement complex data models. This approach is well described in the “Unified Star Schema” paradigm by Francesco Puppini and Bill Inmon. Unlike the relational model, in the Star topology, tables are not connected to each other, but through a central bridge (link table).
The star can be presented in 2 versions: the central table contains fields for calculating measures and general measurements. Dimension tables hang around the central table like the rays of a star. This option is used to optimize cross-tab calculations and may not works with complex models, especially with one-to-many links scenarios. Because of data duplication in central table.
Or, only common dimensions (key fields) are placed in the central table. As well as additional link options. This allows you to implement complex connection scenarios, because a relationship can be described not by one specific value, but by several. For example, to aggregate the amount of sales by employees by user role: by current responsible, or by those who created the deal.
The data tables are joined to the link table by the primary key.
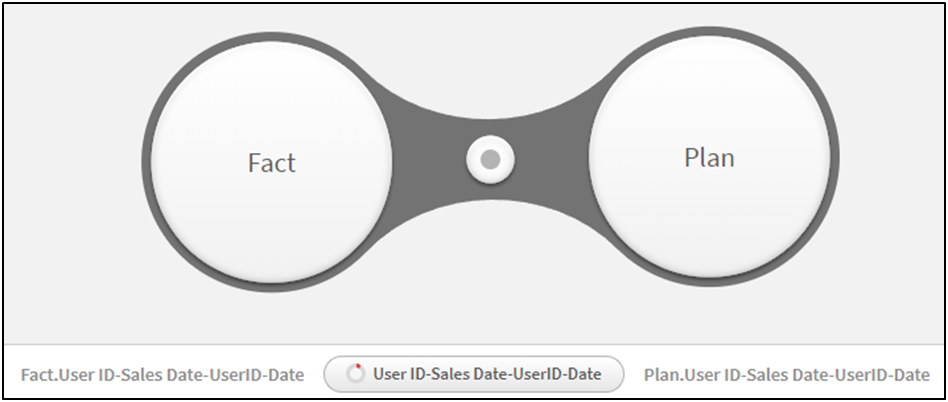
The Plans and Sales table is connected by a composite key by date and user ID
In general, the Star topology is recommended for BI systems, because it allows you to eliminate complex design at the model assembly stage. However, is everything so rosy in practice?
The Star has one main advantage: the collection of a data model with any complexity of relationships, and with any number of tables always follows the same logic, with a fixed set of steps. However, with the standard “let's make a star” approach, it comes with a disadvantage: it is a complex architectural solution that needs to be developed and maintained.
Often for BI tasks, the star topology is formed at the data warehouse level. In theory, this allows the analyst to quickly take the right set of tables, the right block of the link table, and connect them together. If you need to add data, then just add a new table with a new link block, and we don't have any architectural problems.
In fact, this approach has a lot of limitations:
1) Long time adding new data to the model: if you add a new source, you will not be able to fully work with it until it is added to the star. And this can take a long time.
2) Star super-redundancy. Let's say you have 100 tables in your analytics landscape. To fully work with them in a star topology, the central table must contain the relationship of each table to all the others. All so that you can take any set of tables at any time. This is not rational, and not always technically feasible.
3) Complex design. The fact is that adding new data to the star not only brings a new link block to the central table, but also often requires rewriting the link blocks of other tables, whose logic is affected by the new data. Without reinforced concrete standards, your star will turn into an unscalable ball of spaghetti.
Does this mean that the star is too tough for us? Not at all, because its main advantage is unchanged: the collection of a data model of any complexity through a set of standard steps. For 8 years, we have understood this so well that we have created a system that automates the creation of a star for any data set.
This means that you can store your data marts with a simple field naming standard. And when you need to analyze an arbitrary set of tables together - you just select them and automatically get a star.
Adding or dropping tables in the dataset will automatically rebuild the star. Thus, you get a single, easily maintained data model for the entire business, without wasting time on design and infrastructure. Because the star is formed directly inside the Qlik Sense app.
The process of building a model is controlled using the markup of field and tables names:
1) In the names of the fields, you need to use “|” specify the association to which the field belongs.
2) In the table name you need through “|” specify an association that is the primary key.
The process of building a model is controlled using the markup of field and tables names:
1) In the names of the fields, you need to use “|” specify the association to which the field belongs.
2) In the table name you need through “|” specify an association that is the primary key.
After loading the data, the script reads this markup and generates meta-data on it for generating models. The metadata goes to the model generator, and it returns the code to form a star for the current set of tables and its parameters.
Initital model
Data model after generation